Unlock the Power of Your Marketing Data with an Interactive Dashboard
Why Interactive Dashboard
Interactive dashboards can automate reporting activity and provide real time insights to improve decision-making, leading to better outcomes for your business.
Do you face any of following in your reporting activity.
Repetitive and Manual Reporting
Multiple Stakeholders Working on Similar Report
Reports are not 100 % Accurate
No Real Time Consolidated View of Marketing
This leads to slow and error prone reporting at high manhour cost and delayed decision making. Watch our demo video to find out how Interactive Dashboards can help you.
Types of Interactive Dashboards
Functional Dashboard
Marketing
Sales
Marketing
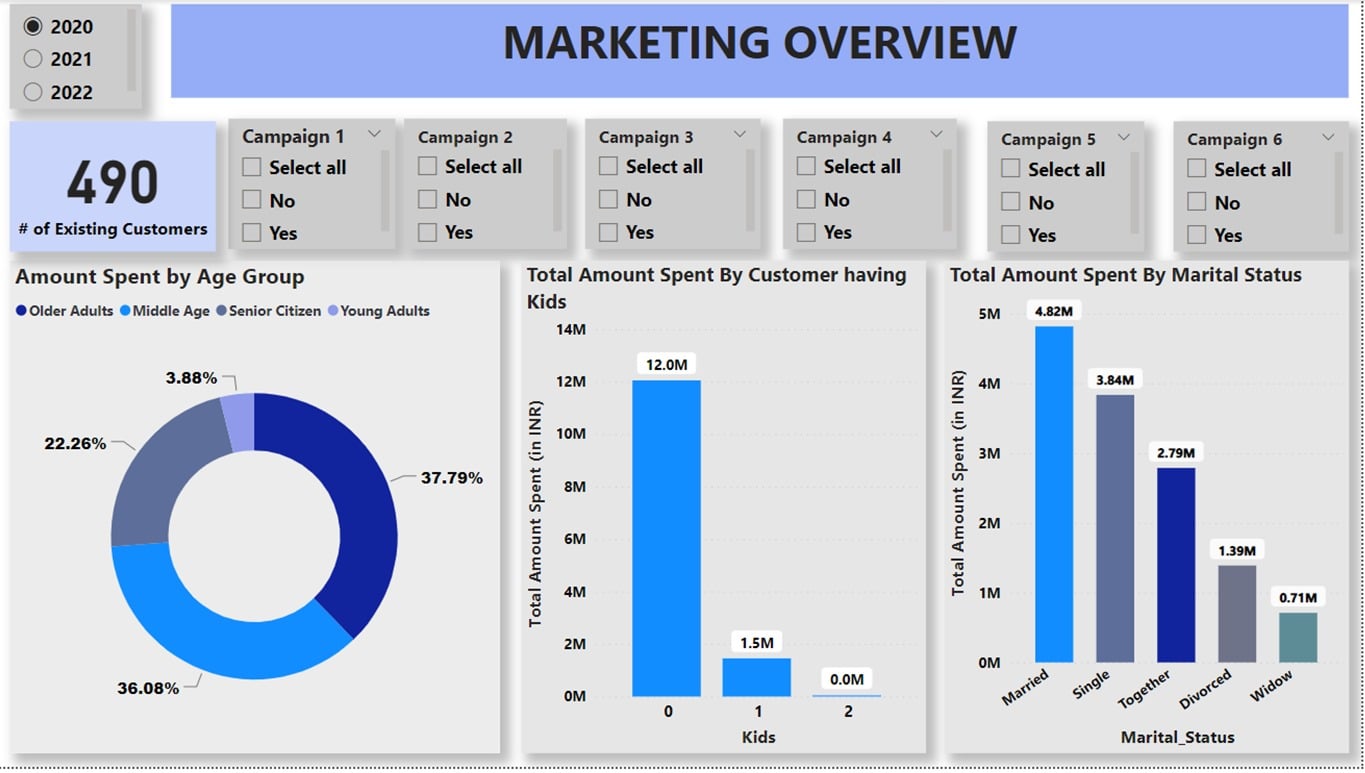
Marketing Dashboard
A marketing dashboard is a tool used for performance management that provides a visual summary of important marketing KPIs. It consolidates data for all marketing campaigns run across different channels in one place for easy tracking and analysis.
Marketing dashboards offer various metrics that can be tracked, such as the Budget Utilization, Cost per Lead, Sources of Web Traffic, Return on Marketing Investment (ROI), Monthly Recurring Revenue (MRR), Annual Recurring Revenue (ARR), Churn Rate, Retention Rate, Number of New Subscribers, Sales by Contact Method etc.
Sales
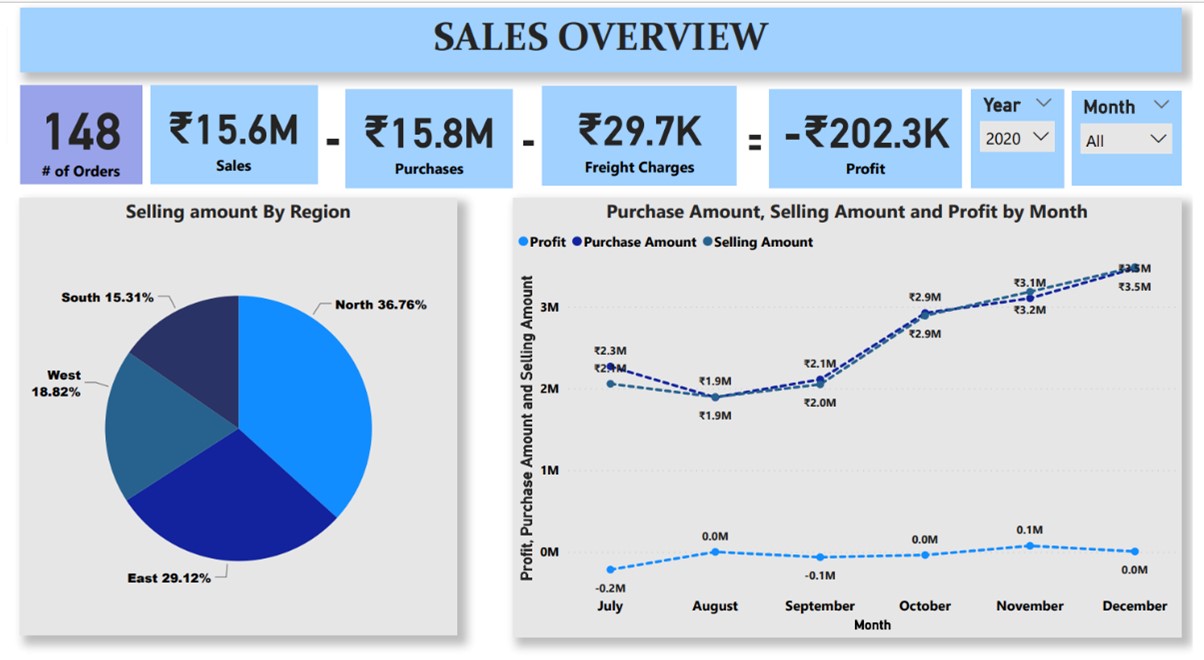
Sales Dashboard
A sales dashboard is a graphical representation of real-time sales data. It is designed to provide an easily understandable overview of key performance indicators, allowing sales representatives and managers to track progress towards sales goals and targets.
Sales Dashboards help businesses track important metrics related to their sales performance. These metrics include Lead Conversion Ratio, Customer Acquisition Cost, Customer Churn Rate, Customer Lifetime Value, Sales Growth, Sales Opportunity Score, Average Revenue Per SKU etc.
Management Dashboard
CEO
CFO
COO
CHRO
CEO
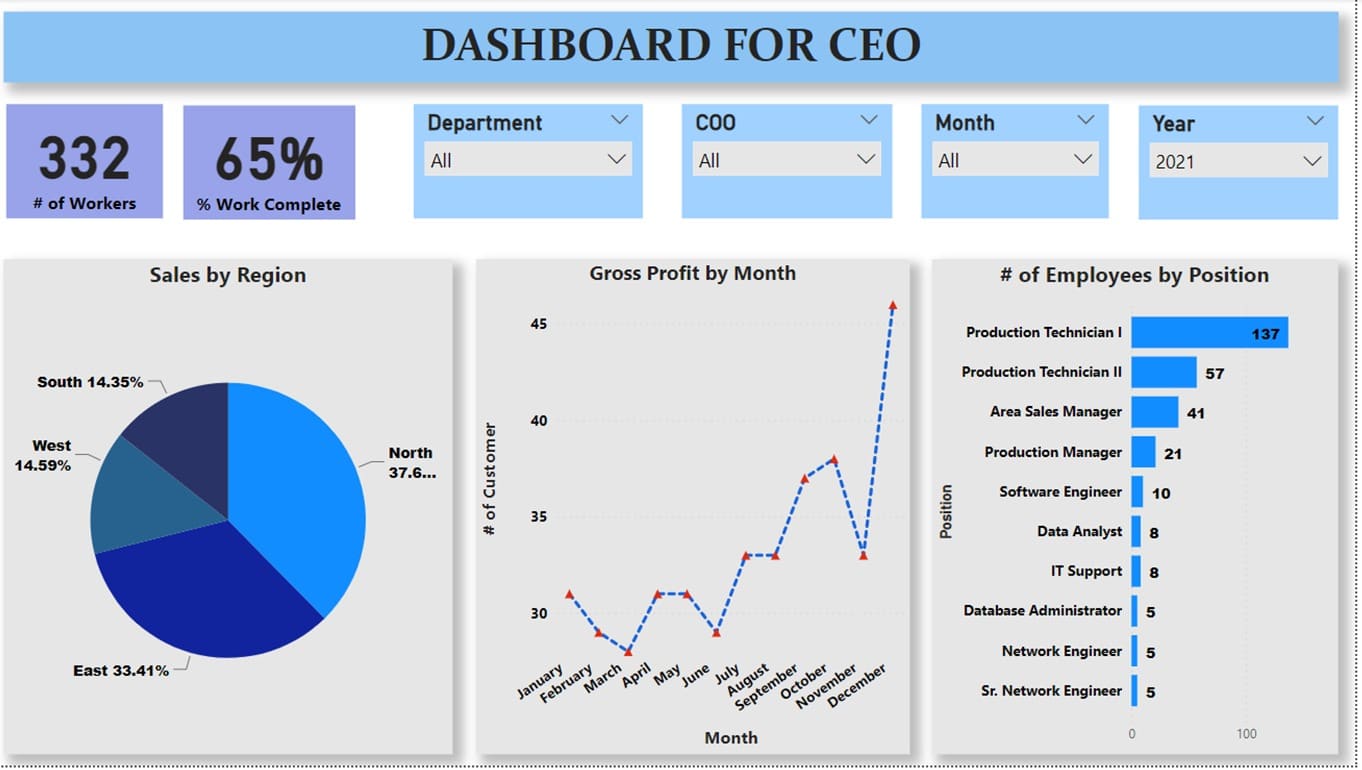
CEO Dashboard
A dashboard designed for a CEO / Managing Director provides a high-level overview of company’s all key performance metrics. It cuts across Marketing, Sales, Production, Supply Chain, Human Resources and Finance.
With a click of button a CEO can get a period, function, geography, product or business line performance. The Dashboard can also be designed to give a cross functional view depending on leadership requirement.
CFO
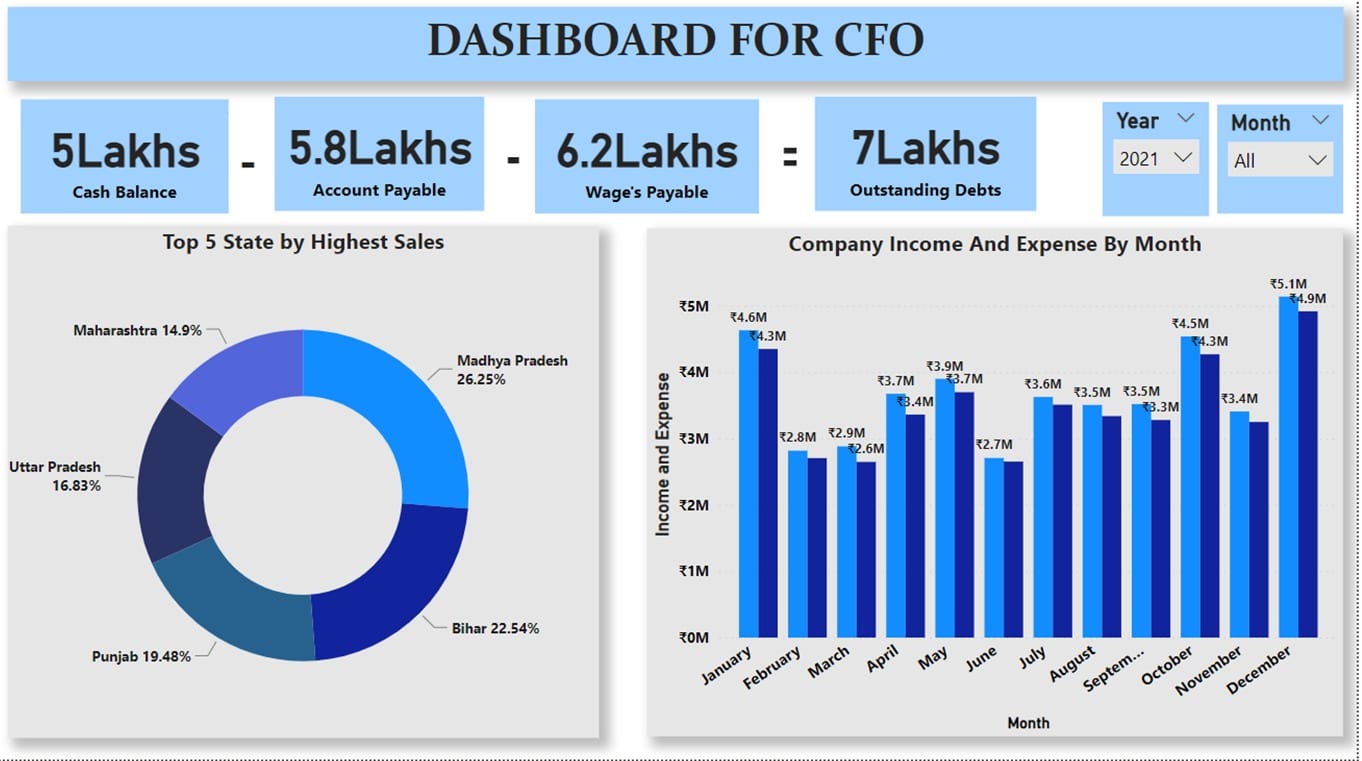
CFO Dashboard
The financial dashboard created for the Chief Financial Officer (CFO) is designed to consolidate and present key financial performance indicators (KPIs) in a user-friendly format. This dashboard includes various analytical tools to help with the organization, analysis, and sharing of important financial data, which can provide insights into the overall financial wellbeing of a company.
Some of the essential metrics that are tracked through this financial dashboard are financial KPIs, such as revenue per employee, current working capital, current assets vs current liabilities, expenses to revenue ratio, etc. By analysing these metrics, the CFO can gain knowledge of accurate and timely payments, reducing the risk of financial loss or damage to the company’s reputation.
COO
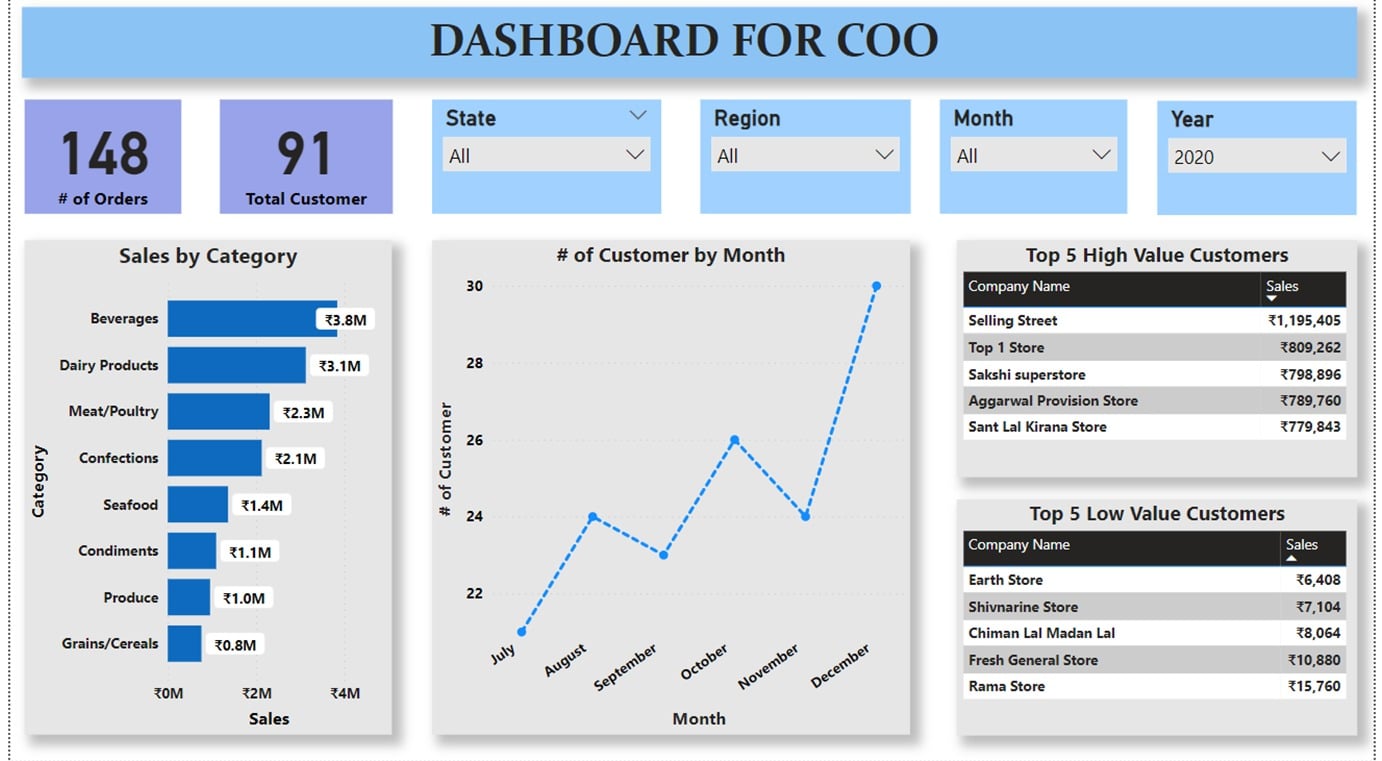
COO Dashboard
The COO dashboard is an advanced visual management tool that allows the Chief Operating Officer (COO) to consolidate and connect data from various sources, enabling them to track, evaluate, and optimize operations within the company. The dashboard provides interactive metrics and advanced analytical capabilities to help the COO in achieving these goals.
The primary metrics tracked on the dashboard include number of projects running and their status in lifecycle, projects delayed, overall productivity, working capital, current ratio, and cash conversion cycle. Analysing these metrics provides valuable insights for the COO to identify areas for improvement and make informed decisions to enhance efficiency and profitability. Overall, the COO dashboard is a powerful tool for visualizing and interpreting complex data to optimize a company’s operational performance.
CHRO
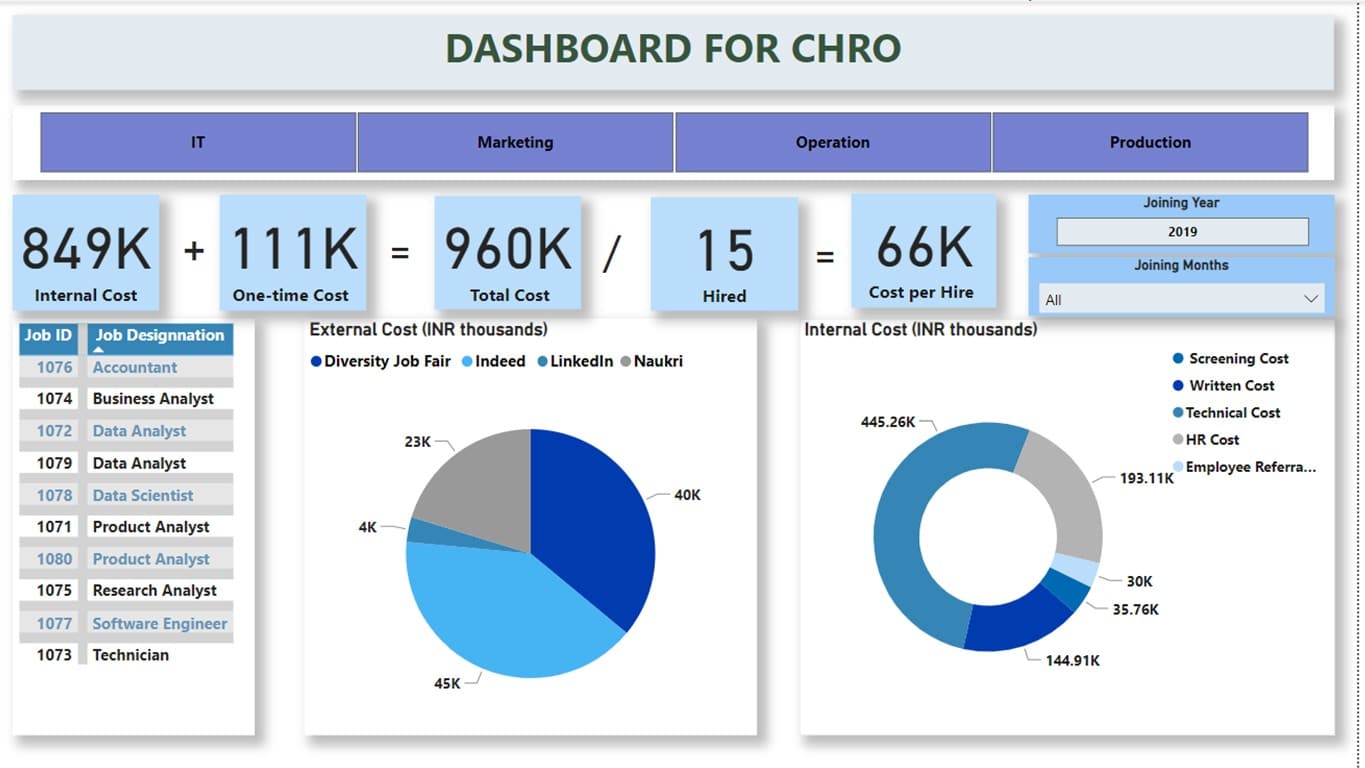
CHRO Dashboard
The CHRO dashboard allows the chief human resources officer (CHRO) in analysing key metrics of HR teams across various departments or business lines on one dashboard. It plays a critical role in people analytics and impacts all departments of an organization.
Key metrics such as cost per employee, cost per hire, training efficiency, overall satisfaction score, churn rate, voluntary turnover rate, and absenteeism, which they can analyse to gain insights into employee performance, engagement, and satisfaction.
Our Approach to Interactive Dashboard Solutions
Interactive Dashboards can be designed and developed as a Consolidated MIS System. If not, it can be broken into multiple functions taking up design and development of one or more functions at a time and then consolidating all functions into a Consolidated MIS System. In either case, implementation cycle as given below shall be followed.
Interactive Dashboard Cases
To know more about our Interactive Dashboard cases, please visit cases section.
Partner With Propell Action For Interactive Dashboard
Before offering Data Visualization solutions in the form of Interactive Dashboards, we learn your business goals from you and help you identify real reports that you need on daily basis. This ensures that dashboard requirement is limited to actual use. This contains cost and expedite deliverables. Beyond data we understand importance of people in your business and hence couple our solutions with change management and training.